Physical Risk Services
Area Location
Risk Intelligence
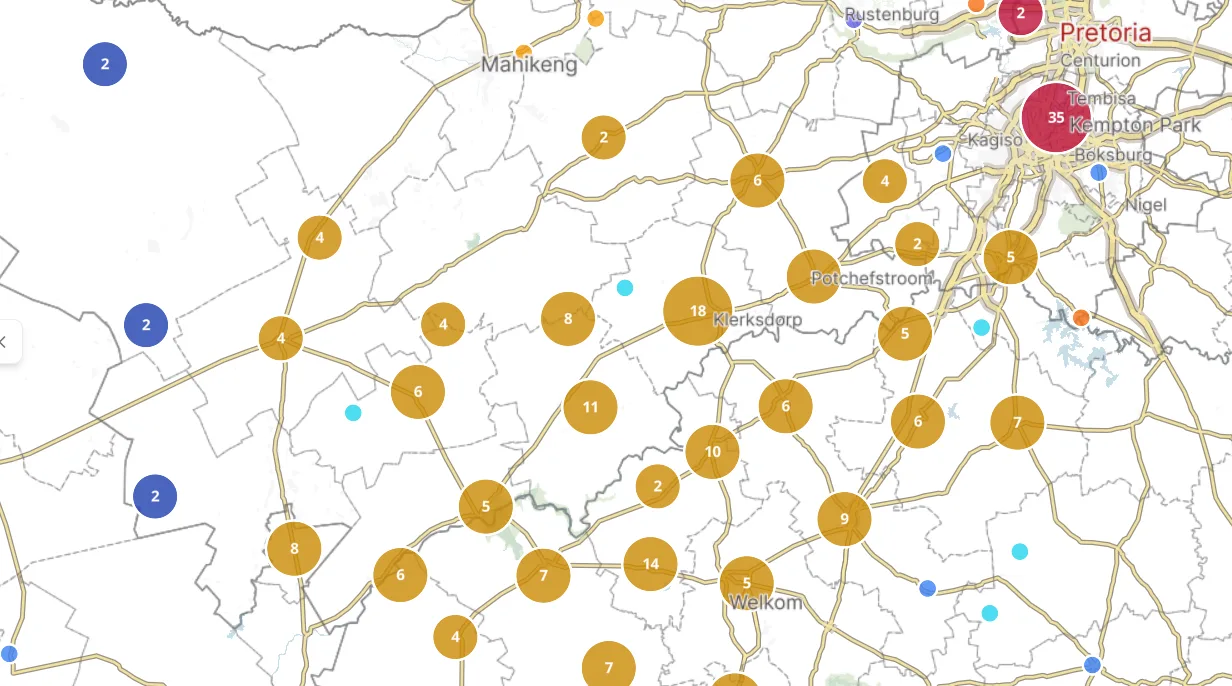
Visualise risk across your whole portfolio on a live map - filter by peril (flood, wildfire, seismic, coastal) and drill into any site for area risk analysis, exposure distribution and severity breakdowns, grounded in geospatial intelligence and actuarial science.
Last-Metre Precision in
Commercial Property Risk
In commercial property, risk mitigation is the cornerstone of long-term asset viability and financial stability. Riskscape's Assets, Location & Risk provides a sophisticated geospatial hazard intelligence layer that moves beyond generic data to deliver site-specific precision.
Accurate Pricing
Identify exposure to flood, landslide, fire and seismic risks to more accurately price insurance premiums and safeguard mortgage portfolios against physical climate risks.
Infrastructure Resilience
Ensure infrastructure resilience through multi-hazard assessment at asset level - moving beyond generic postcode data to property-level, remotely-sensed intelligence.
Capital Protection
Proactively manage perils that could otherwise result in catastrophic capital loss or business interruption - with confidence grounded in locally calibrated South African data.
8 Perils. One Unified Platform.
Each peril is modelled independently at property level, then layered into a single risk aggregation view - giving you cumulative exposure across your entire portfolio.
Surface Water Flood
River Flood
Wildfire
Seismic
Micro Landslide
Coastal
Extreme Weather
Dolomite
Comprehensive Hazard Intelligence
Across Every Risk Dimension
Each site report delivers structured, queryable data across crime, flood, climate, seismic, coastal, financial and emergency access dimensions - every field grounded in SA-specific datasets.
Crime & Safety
- Crime Index - Area-level index based on SAPS police crime data
- Category - Risk classification from Low to Extreme
- Crime Index (Estates) - Estate-specific crime scoring
- Crime Index (Complexes) - Complex-specific crime scoring
Flood Risk
- General Flood Index - Composite surface and river flood vulnerability
- Infrastructure Index - Flood exposure relative to surrounding infrastructure
- Category - Low / Moderate / High / Extreme classification
- Infrastructure Category - Risk band for surrounding infrastructure
Climate & Weather
- Annual & Monthly Temperature - Average, minimum and maximum temperature trends
- Precipitation - Annual and monthly average rainfall at area level
- Humidity - Monthly humidity data at area level
- Hail Days / Lightning - Avg hail days per year and lightning flash density per km²
Seismic & Dolomite
- PGA 200-year return - Peak Ground Acceleration for 200-year event
- PGA 100-year return - Peak Ground Acceleration for 100-year event
- PGA 50-year return - Peak Ground Acceleration for 50-year event
- Dolomite Risk Class - Proximity and presence of dolomite in the area
Coastal Risk
- Distance to Coast - Straight-line distance from property to coastline
- Ocean Hazard Index - Composite ocean-driven hazard score
- Storm Hazard Index - Exposure to coastal storm surge risk
- Height Above Sea Level - Elevation relative to mean sea level
Financial
- Market Growth - Quarterly value growth for full and sectional title properties
- Household Financial Index - Income level assessed from property valuation and demographics
- Downturn LTV - Loan-to-value under market downturn scenarios
- Income Class - Area income classification (e.g. Upper Middle)
Emergency Access
- Police Station - Distance to nearest police station
- Fire Brigade - Distance to nearest fire station
- Public Hospital with ER - Distance to nearest emergency room
- Private Hospital - Distance to nearest private hospital
Crime & Safety (Estates)
- Informal Settlement Proximity - Distance to nearest informal settlement
- Total Trades - Number of property transactions in the area
- Downturn Dynamics - Market stress indicators under downturn conditions
- Trading Liquidity - Measure of how actively properties trade in the area
Site Manager - Full Portfolio View
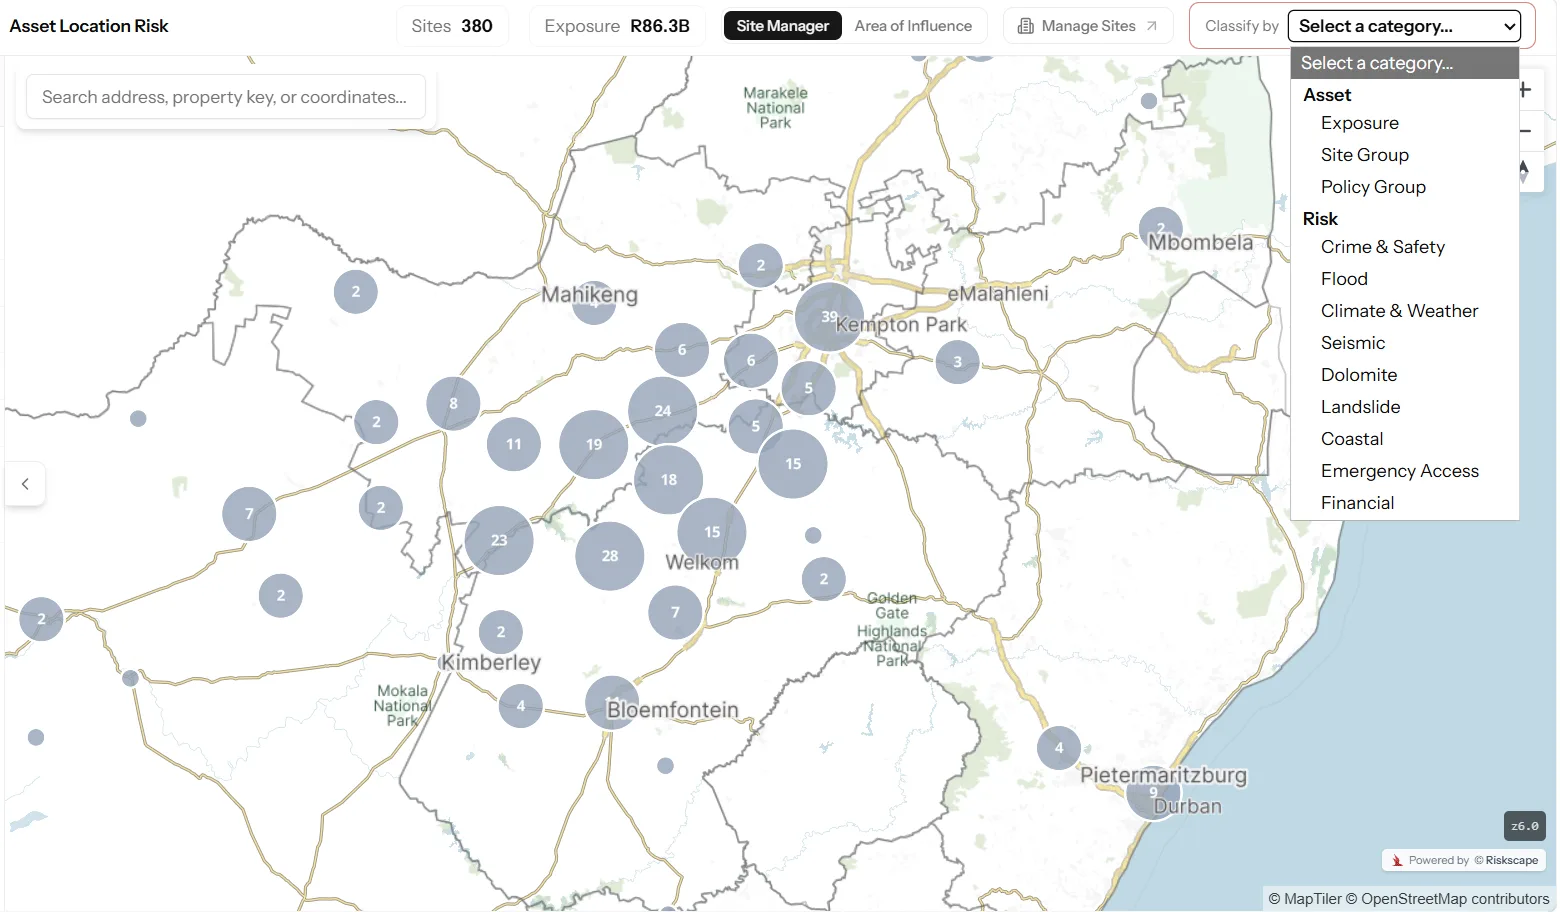
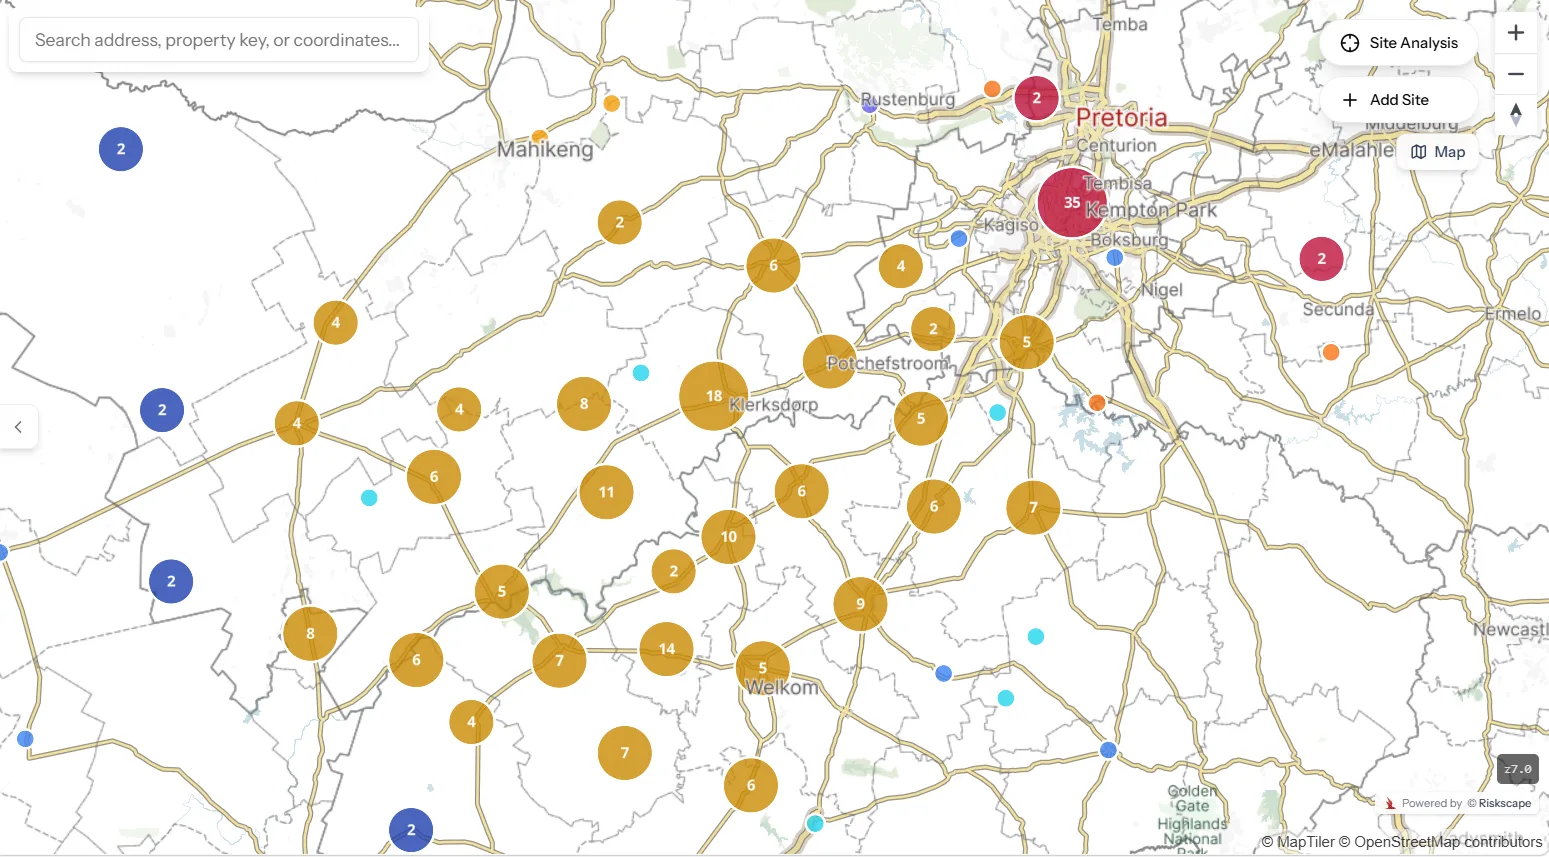
The Site Manager provides a live, interactive map of your entire asset portfolio. Every site is plotted, clustered by proximity, and instantly classified by any risk or asset dimension - giving portfolio managers, underwriters and risk officers a single, authoritative view of exposure.
Asset Classification
- Exposure - Colour-code clusters by total insured value or asset exposure in rand
- Site Group - Group and visualise sites by business unit, region or policy class
- Policy Group - Classify sites by policy type for portfolio-level underwriting views
Risk Classification
- Crime & Safety - Colour-grade all sites by area-level crime index from SAPS data
- Flood - Visualise flood risk exposure across the portfolio in a single view
- Climate & Weather - Temperature, rainfall and severe weather risk at site level
- Seismic - Peak Ground Acceleration and seismic hazard classification per site
- Dolomite - Dolomite risk classification and sinkhole potential per site
- Landslide - Micro-landslide and slope instability risk per site
- Coastal - Coastal exposure, storm surge and sea-level height per site
- Emergency Access - Proximity to police, fire and medical emergency services
- Financial - HFI, LTV and market dynamics for every site in the portfolio
Area of Influence
Define and visualise the area of influence around each site - critical for understanding which surrounding hazards, infrastructure and demographics affect a specific asset's risk profile.
Book a Live DemoBuilt for Decision-Makers
From live map visualisation to one-click reporting and full API integration - the platform fits your workflow.
Interactive Dashboards
High-resolution hazard layers including flood, seismic and wildfire risks visualised on a live map. Filter by risk category and drill into individual sites for exposure distribution and severity breakdowns.
Seamless Integration
Robust REST API for direct ingestion into underwriting platforms, portfolio management systems and decisioning workflows - built for production workloads in any technology stack.
Actionable Reporting
One-click PDF exports for rapid stakeholder communication and audits. Structured outputs ready for insurers, lenders, engineers and risk managers.
The Technology Behind
Every Assessment
Four capabilities every site assessment is built on - from where the asset actually is, to what stands on it, to how its perils add up.
HD Addressing & Mapping
3D Structure Detection
Risk Aggregation
Physical Risk Assessments
Ready to Assess Your Asset Portfolio?
Book a consultation with our team and discover how Riskscape's Assets, Location & Risk platform can power your underwriting, lending and property risk decisions.