Two identical buildings
are not the same asset.
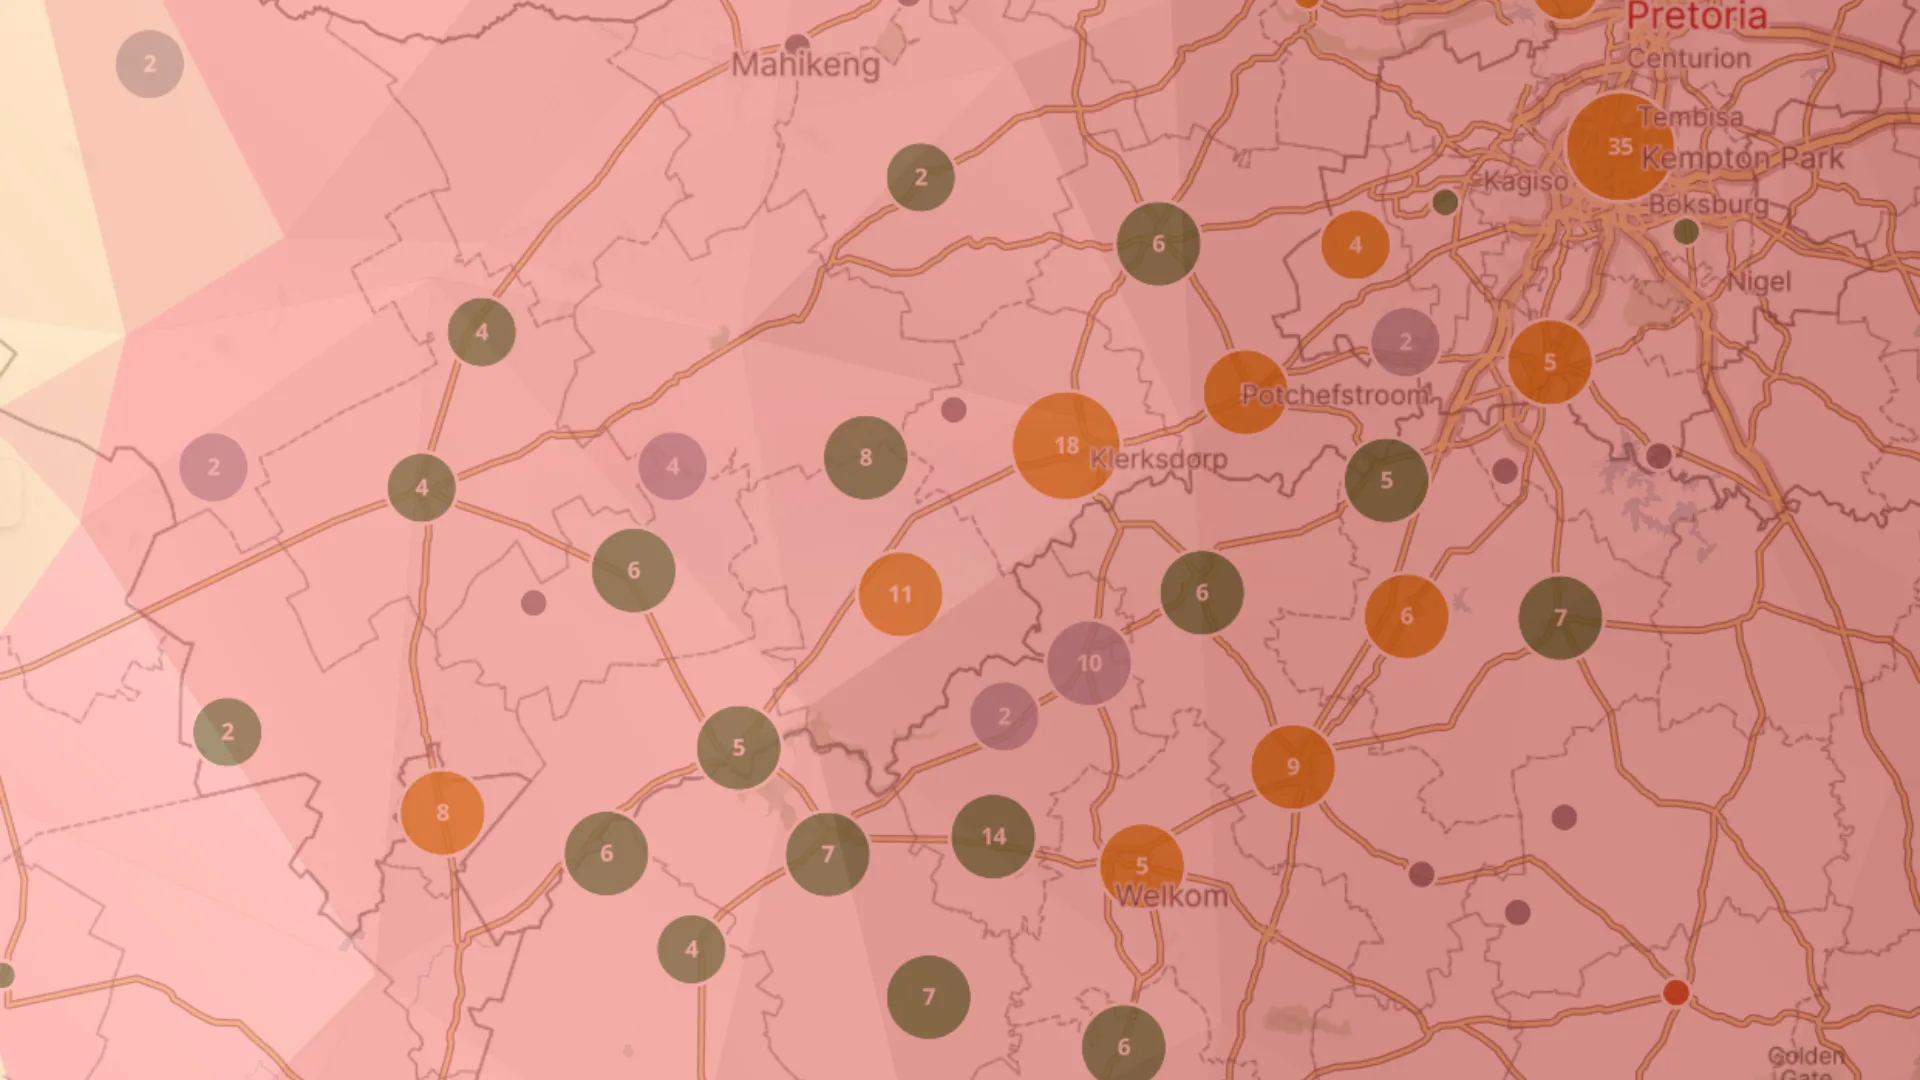
The surrounding economy, ownership mix and trade activity decide what a property is worth and who will use it. Location Information is the tier the market underrates, and the one that opens the trade-area conversation.
What surrounds the asset
Nine reads of the catchment around any site or proposed site, each measured at neighbourhood grain.
Demographics
Household Financial Index
Property dynamics
Mortgage activity
Competitive landscape
Settlement profile
Facility density & gaps
Custom catchments
Trading outlook
From the smallest pixel up
Riskscape starts at the bottom. The smallest observable unit is a 2 m pixel, and everything is built upwards from there: pixel to stand, stand to neighbourhood, then subplace/suburb, city or town, municipality, province. Every area figure is the sum of real observations, computed once and consistent at every level built from it.
Most providers work the other way round
They start with a national or global dataset and disaggregate downwards, so the figure at your address is a share of a coarse average. Riskscape does not build data that way.
That is what makes a custom catchment trustworthy. Draw a radius or your own boundary and ALR resolves it to the neighbourhoods inside it. Redraw the line and the answer still holds, because the measurements underneath it do not move.
- 2 m pixel2 msource↓ Everything below is built from here
- Stand / erfmillionsstands
- Neighbourhood~130 000areas
- Subplace / suburb~25 000areas
- City / town~1 500areas
- Municipality213areas
- Province9areas
The same catchment, read for your business
Location output is delivered as an area report, a full read of the catchment around any site or proposed site. The metrics are common. What changes is which of them decide your case.
Bank branches
- Bond market share by lender, split by full and sectional title
- Each year's new bonds by lender across the seven-year window
- Share of sales registered with a bond, by title type and by year
- Which banks hold branches in the area, and how far the nearest sits
- Household income class distribution and average income band
- Downturn loan-to-value by title type, property-count weighted
Retail & grocery
- Every named retail centre inside the area, with its category
- Competing centres within 2 km, with distance from the boundary
- Trading sites by brand and format from the Core POI layer
- Residents per supermarket, counted inside and within 2 km
- Life-stage shares read against retail behaviour
- House price classification from entry through to luxury
Fuel & forecourt
- Seasonal comfort classification for each of the four seasons
- Fuel stations inside the area and on the surrounding arterials
- Night-time population and population density classification
- Age distribution by life stage, including the young-adult share
- Gym and fitness provision, inside and within 2 km
- Annual rainfall, sunshine days and hail frequency by month
Hospital groups
- Named healthcare facilities inside the area
- Nearest facilities beyond the boundary, with distances
- Residents per healthcare facility, inside and within 2 km
- Road distance to the nearest private hospital and public emergency room
- Pre-retiree and retiree shares of the population
- Life-stage bands read against insurance need
Franchise networks
- Where the area ranks against others in its municipality
- Market classification per title type, and how rare that category is nationally
- Neighbourhood composition, for targeting inside the area
- Three-year turnover and average time held
- Growth momentum and effective escalation against nominal price growth
- Competitor brands and formats already trading in the area
- A generated insight list, produced by a fixed rule set
Inside every area report. Every figure is drawn from Riskscape production data. Nothing is modelled, illustrative or invented. Where a dataset has no coverage for an area it is shown as not available rather than filled in. Insights are generated by a fixed rule set, so the summary and the section it came from always say the same thing.
Go deeper.
The other parts of ALR, each on its own page.
Pick a suburb. Any suburb.
Name an area and we will send you the full report before the call. It is the same output your team would generate, on ground you already know, so you can check it against your own judgement.