Twelve dimensions,
modelled in-house.
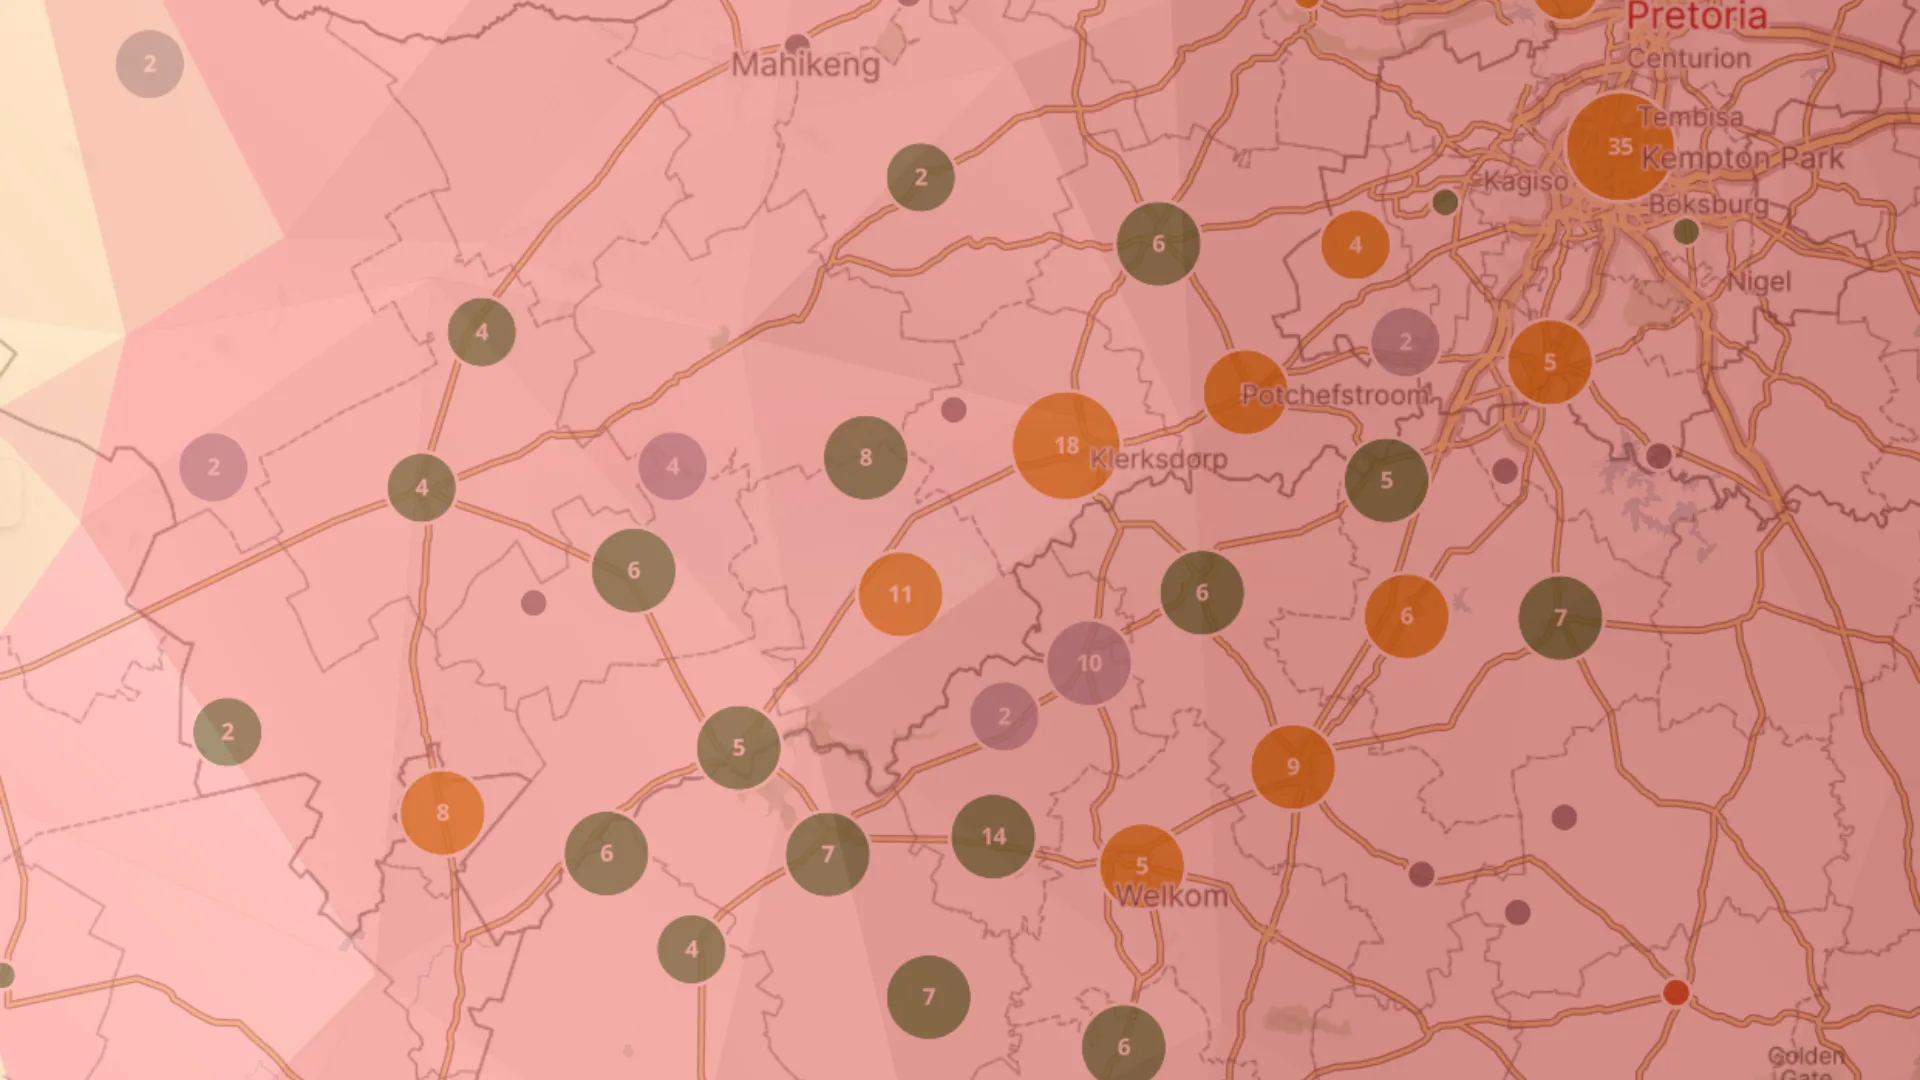
Each hazard modelled independently at property level, then layered into a single aggregation view. Exposure can be read one site at a time or across the whole book. Flood, fire, weather and ground models are ours end to end.
Twelve dimensions, one aggregation view
Each dimension is modelled independently at property level and layered into a single view, so exposure reads one site at a time or across the whole book.
National hydrodynamic model
Wildfire severity & frequency
Seismic & dolomite
Emergency access
Crime & safety
Extreme weather & coastal surge
How much sits in one place
A portfolio can be well priced site by site and still be dangerously concentrated. ALR aggregates every peril into a single view so you can see what one flood, one fire or one hailstorm reaches at once, by business unit, region, policy class or the whole book.
Rules you set
- MAX 5 SITES - No more than five sites inside one flood concentration zone
- MIN 250 m - No two sites closer to each other than a distance you set
- MAX R50m - Total exposure inside a zone may not pass a value you set
- FLOOD ≥ High - Cap how much may sit in a single hazard band
- PER CENTRE - Limit outlets or branches within one catchment or retail node
Test a risk against the book it would join
The same rules run forward as well as backward. Enter a candidate address, such as a new warehouse, retail centre or office park, and ALR re-runs your limits with that site included, as a hypothetical, before anything is bound. Not “is this risk acceptable” but “is it acceptable given the eleven others we already hold in that zone”.
Illustrative. The site passes on its own merits and still breaches on accumulation. That is the case an underwriter cannot see without asking someone to run a report. The same rule set governs portfolio monitoring, pre-bind testing and the view your brokers see.
Go deeper.
The other parts of ALR, each on its own page.
Send us a hundred properties.
We will score them across all twelve dimensions and hand back the results with the method notes, so your risk team can test them against loss experience they already have.